Jellyfish is a lightweight and high-performance distributed microservice real-time monitoring system written in Java, which can seamlessly connect with SpringBoot or SpringCloud projects
Composition of Jellyfish:
- Unified collection and query of application logs
- Statistics and monitoring of
SpringBootapplication HTTP interface 3 indicators: request time, error rate, concurrency
How Jellyfish is deployed?
Jellyfish is divided into server side and agent side Server is usually an independent SpringBoot application or cluster. The cluster mode is implemented through another microservice distributed collaboration framework tridenter. The Jellyfish server also needs to deploy Redis and ElasticSearch Agent side is usually another group of SpringBoot applications or clusters that have joined the jellyfish-related jar package, and they send data packets to the server in real time.
Jellyfish Feature:
- Jellyfish server is based on the streaming computing framework vortex (the bottom layer is Netty4), low latency, high concurrency, and supports two transmission protocols: TCP and HTTP
- The network communication layer of the Jellyfish server relies on the vortex framework, supports dynamic horizontal expansion, and supports final data consistency
- Jellyfish’s application interface statistics are quasi real-time, pure memory calculations, the default statistical time window is 1 minute (customizable), but the increase in the number of statistical interfaces may affect the real-time performance. After testing, the maximum delay remains at Within 1 minute, the average delay is on the order of seconds.
Jellyfish Structure:
- jellyfish-console
Jellyfish Web console can run independently, usually as a server, of course, you can also customize the server by using the annotation
@EnableJellyfishServer - jellyfish-http-spring-boot-starter jar package, Agent package for Jellyfish monitoring application program interface for index statistics
- jellyfish-slf4j jar package, Jellyfish docking with slf4j (currently only logback docking is implemented), unified application of log collection agent package
- jellyfish-spring-boot-starter Jellyfish core jar package, which implements all core functions
Install:
<dependency>
      <artifactId>jellyfish-spring-boot-starter</artifactId>
     <groupId>com.github.paganini2008.atlantis</groupId>
     <version>1.0-RC3</version>
</dependency>
How to use Jellyfish Console?
**How to use slf4j and collect logs uniformly? **
Your application needs:
- add dependency in pom.xml
<dependency>
      <artifactId>jellyfish-slf4j</artifactId>
     <groupId>com.github.paganini2008.atlantis</groupId>
     <version>1.0-RC3</version>
</dependency>
- Edit logback.xml
<?xml version="1.0" encoding="utf-8" ?>
<configuration>
<appender name="logTracker" class="indi.atlantis.framework.jellyfish.slf4j.logback.HttpTransportClientAppender">
<applicationName>tester5</applicationName> <!-- 修改成你的applicationName -->
<brokerUrl>http://192.168.159.1:10010</brokerUrl> <!-- 修改Jellyfish console地址 -->
</appender>
<!-- omit other configuration -->
<root level="info">
<appender-ref ref="STDOUT" />
<appender-ref ref="INFO" />
<appender-ref ref="ERROR" />
<appender-ref ref="logTracker" />  <!-- 引用你定义的appender -->
</root>
</configuration>
Currently only logback is supported, more will be supported in the future
-
First Startup Jellyfish-console Java command:java -jar jellyfish-console-1.0-RC1.jar
Default port:6100 Location:http://localhost:6100/jellyfish/log/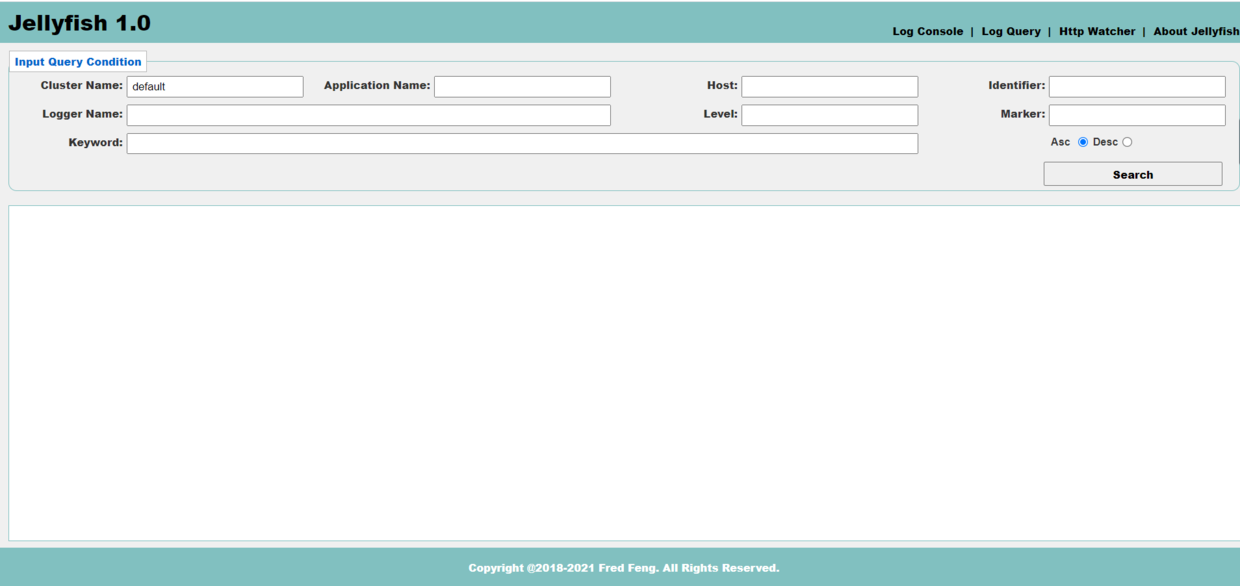
-
Start your application again, and logs will continue to flow into the Jellyfish Console at this time:
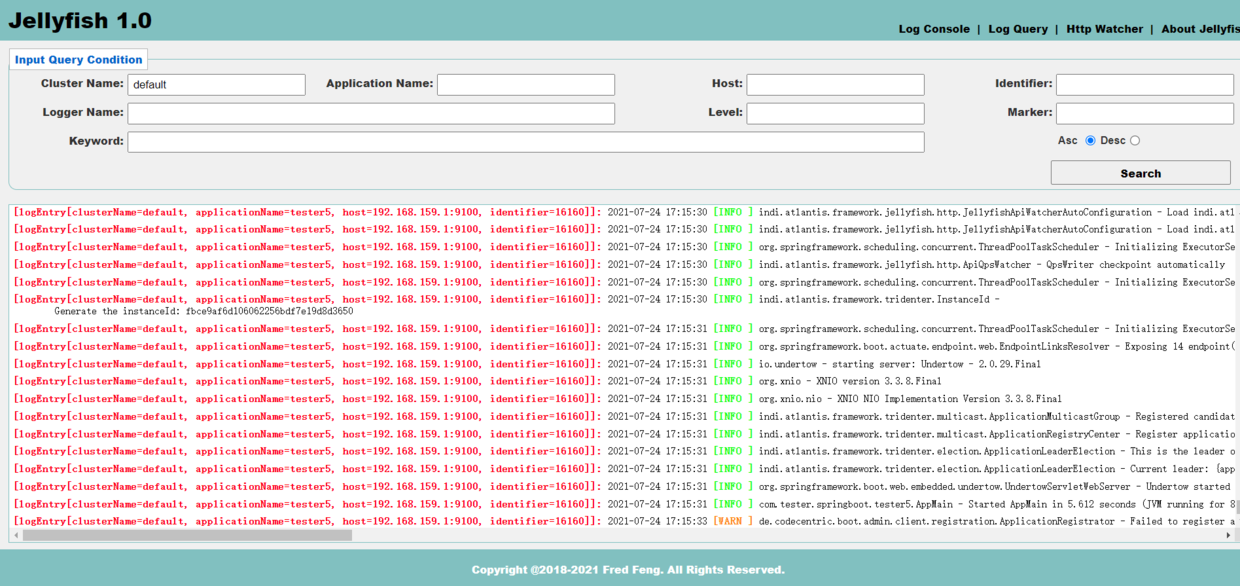
Description: Each line of log data received by the jellyfish server from the agent will be stored in ElasticSearch.
How to connect to Spring Boot or Spring Cloud projects and count HTTP interface metrics? Your application needs:
- add dependency in pom.xml:
<dependency>
<artifactId>jellyfish-http-spring-boot-starter</artifactId>
<groupId>com.github.paganini2008.atlantis</groupId>
<version>1.0-RC3</version>
</dependency>
- add a line in application.properties:
atlantis.framework.jellyfish.brokerUrl=http://xxx.xxx.xxx.xxx:6100 # Jellyfish console location
- Use a pressure test tool to test a certain interface, as shown in the figure:
Http API List:
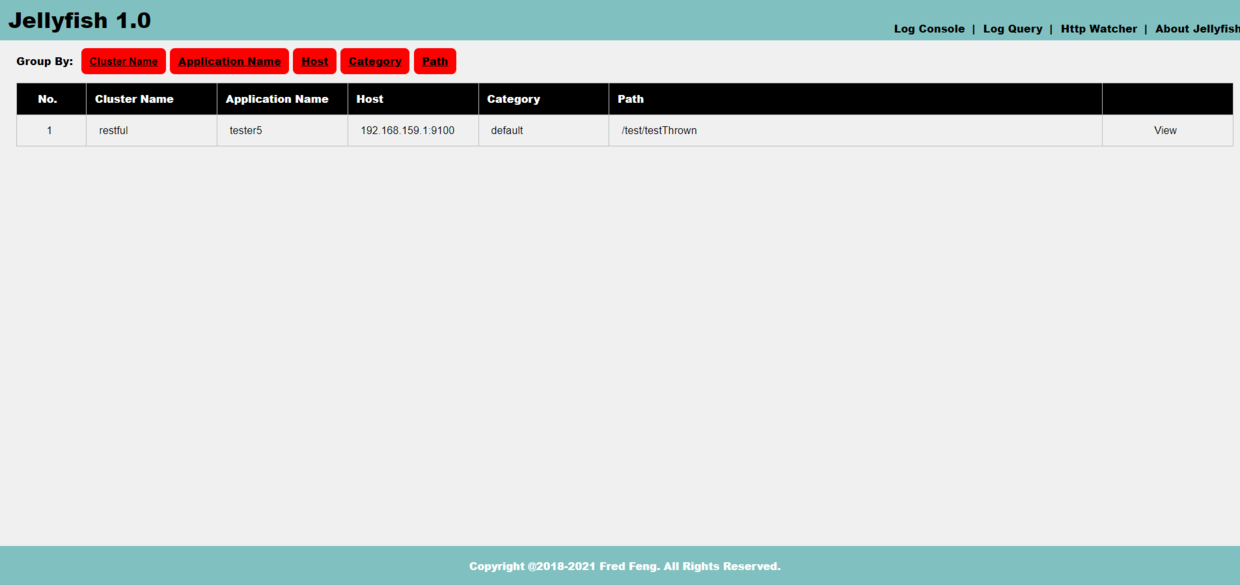
Click [View], it will open the statistics details page all the time, the page is relatively long
First At the top, you will see an overview of the interface and some statistics
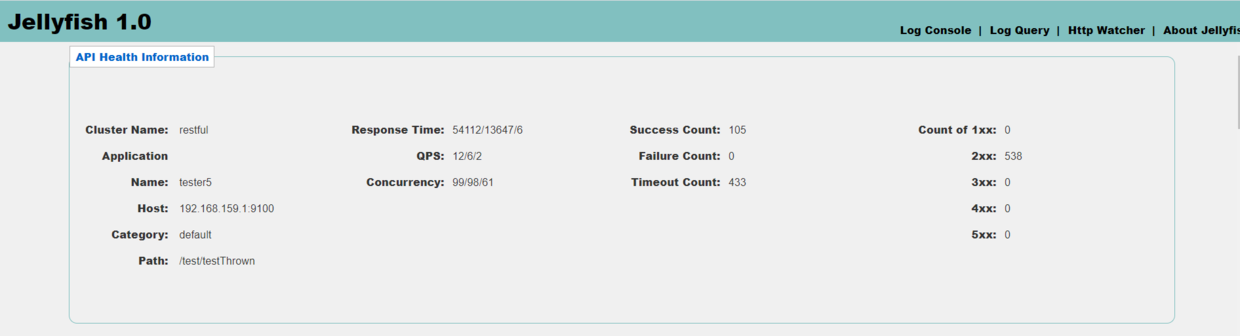
And then will see some dashboards:
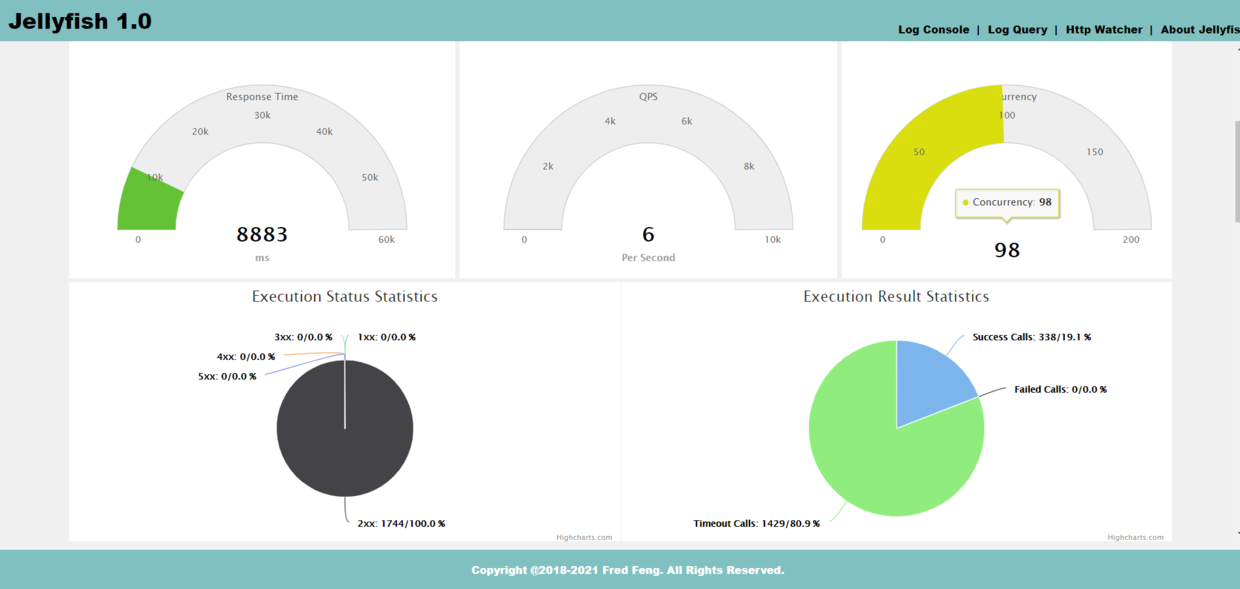 The dashboard in the figure above shows the current concurrency, QPS, average response time, and then two pie charts to monitor the http status code and interface execution results.
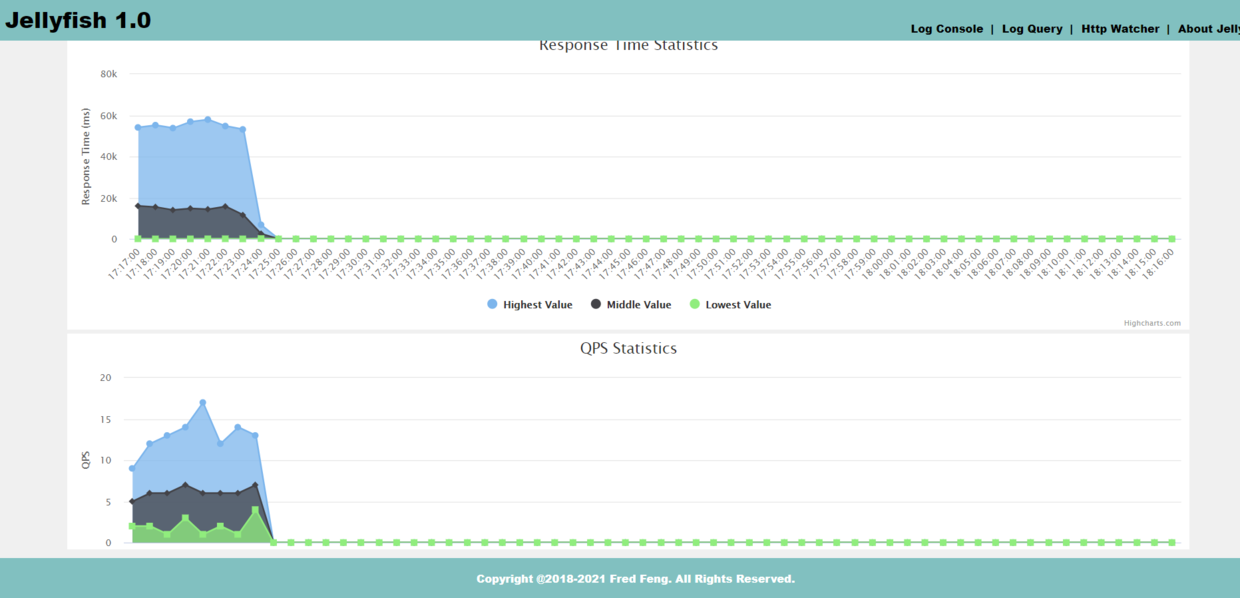
** Then ** Scroll down and you will see several big pictures, all of which are counted by the minute
Response time statistics and QPS statistics
The dashboard in the figure above shows the current concurrency, QPS, average response time, and then two pie charts to monitor the http status code and interface execution results.
** Then ** Scroll down and you will see several big pictures, all of which are counted by the minute
Response time statistics and QPS statistics
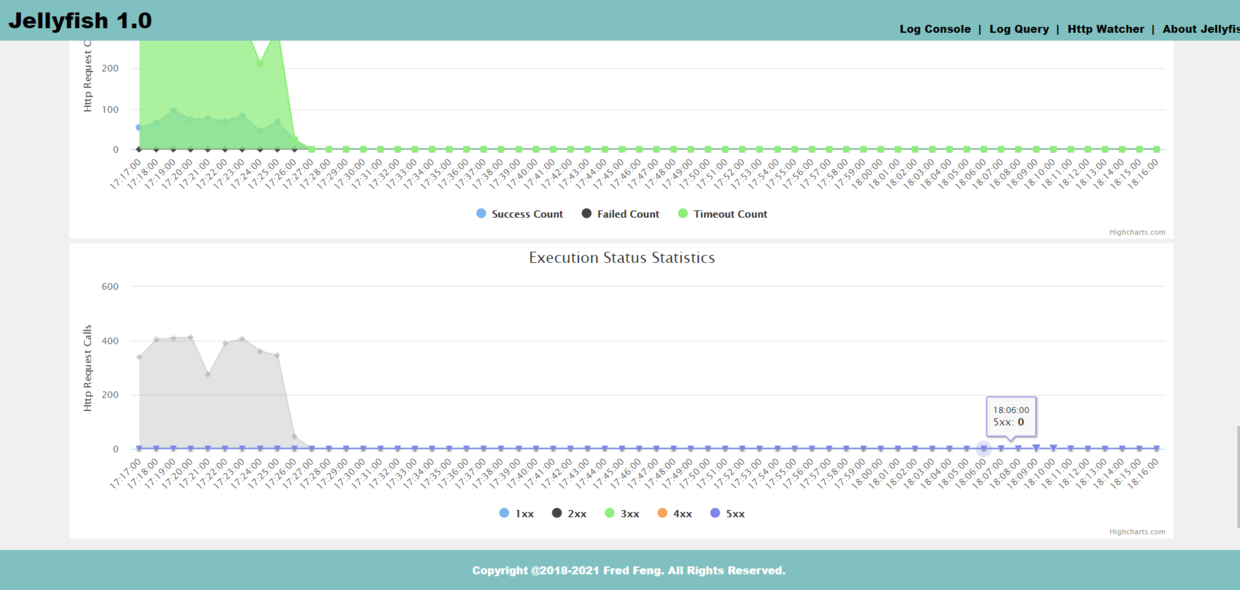
The last display is Interface call count and Http status code statistics
Sample json data:
{
"msg": "ok",
"data": {
"20:05:00": {
"rt": {
"middleValue": 0,
"count": 0,
"highestValue": 0,
"lowestValue": 0,
"timestamp": 1623585900737
}
},
"20:06:00": {
"rt": {
"middleValue": 0,
"count": 0,
"highestValue": 0,
"lowestValue": 0,
"timestamp": 1623585960737
}
},
"20:07:00": {
"rt": {
"middleValue": 0,
"count": 0,
"highestValue": 0,
"lowestValue": 0,
"timestamp": 1623586020737
}
},
"20:08:00": {
"rt": {
"middleValue": 0,
"count": 0,
"highestValue": 0,
"lowestValue": 0,
"timestamp": 1623586080737
}
},
"20:09:00": {
"rt": {
"middleValue": 0,
"count": 0,
"highestValue": 0,
"lowestValue": 0,
"timestamp": 1623586140737
}
},
"20:10:00": {
"rt": {
"middleValue": 0,
"count": 0,
"highestValue": 0,
"lowestValue": 0,
"timestamp": 1623586200737
}
},
"20:11:00": {
"rt": {
"middleValue": 0,
"count": 0,
"highestValue": 0,
"lowestValue": 0,
"timestamp": 1623586260737
}
},
"20:12:00": {
"rt": {
"middleValue": 0,
"count": 0,
"highestValue": 0,
"lowestValue": 0,
"timestamp": 1623586320737
}
},
"20:13:00": {
"rt": {
"middleValue": 0,
"count": 0,
"highestValue": 0,
"lowestValue": 0,
"timestamp": 1623586380737
}
},
"20:14:00": {
"rt": {
"middleValue": 0,
"count": 0,
"highestValue": 0,
"lowestValue": 0,
"timestamp": 1623586440737
}
},
"20:15:00": {
"rt": {
"middleValue": 0,
"count": 0,
"highestValue": 0,
"lowestValue": 0,
"timestamp": 1623586500737
}
},
"20:16:00": {
"rt": {
"middleValue": 0,
"count": 0,
"highestValue": 0,
"lowestValue": 0,
"timestamp": 1623586560737
}
},
"20:17:00": {
"rt": {
"middleValue": 0,
"count": 0,
"highestValue": 0,
"lowestValue": 0,
"timestamp": 1623586620737
}
},
"20:18:00": {
"rt": {
"middleValue": 0,
"count": 0,
"highestValue": 0,
"lowestValue": 0,
"timestamp": 1623586680737
}
},
"20:19:00": {
"rt": {
"middleValue": 0,
"count": 0,
"highestValue": 0,
"lowestValue": 0,
"timestamp": 1623586740737
}
},
"20:20:00": {
"rt": {
"middleValue": 0,
"count": 0,
"highestValue": 0,
"lowestValue": 0,
"timestamp": 1623586800737
}
},
"20:21:00": {
"rt": {
"middleValue": 0,
"count": 0,
"highestValue": 0,
"lowestValue": 0,
"timestamp": 1623586860737
}
},
"20:22:00": {
"rt": {
"middleValue": 0,
"count": 0,
"highestValue": 0,
"lowestValue": 0,
"timestamp": 1623586920737
}
},
"20:23:00": {
"rt": {
"middleValue": 0,
"count": 0,
"highestValue": 0,
"lowestValue": 0,
"timestamp": 1623586980737
}
},
"20:24:00": {
"rt": {
"middleValue": 0,
"count": 0,
"highestValue": 0,
"lowestValue": 0,
"timestamp": 1623587040737
}
},
"20:25:00": {
"rt": {
"middleValue": 0,
"count": 0,
"highestValue": 0,
"lowestValue": 0,
"timestamp": 1623587100737
}
},
"20:26:00": {
"rt": {
"middleValue": 0,
"count": 0,
"highestValue": 0,
"lowestValue": 0,
"timestamp": 1623587160737
}
},
"20:27:00": {
"rt": {
"middleValue": 0,
"count": 0,
"highestValue": 0,
"lowestValue": 0,
"timestamp": 1623587220737
}
},
"20:28:00": {
"rt": {
"middleValue": 0,
"count": 0,
"highestValue": 0,
"lowestValue": 0,
"timestamp": 1623587280737
}
},
"20:29:00": {
"rt": {
"middleValue": 0,
"count": 0,
"highestValue": 0,
"lowestValue": 0,
"timestamp": 1623587340737
}
},
"20:30:00": {
"rt": {
"middleValue": 0,
"count": 0,
"highestValue": 0,
"lowestValue": 0,
"timestamp": 1623587400737
}
},
"20:31:00": {
"rt": {
"middleValue": 0,
"count": 0,
"highestValue": 0,
"lowestValue": 0,
"timestamp": 1623587460737
}
},
"20:32:00": {
"rt": {
"middleValue": 0,
"count": 0,
"highestValue": 0,
"lowestValue": 0,
"timestamp": 1623587520737
}
},
"20:33:00": {
"rt": {
"middleValue": 0,
"count": 0,
"highestValue": 0,
"lowestValue": 0,
"timestamp": 1623587580737
}
},
"20:34:00": {
"rt": {
"middleValue": 0,
"count": 0,
"highestValue": 0,
"lowestValue": 0,
"timestamp": 1623587640737
}
},
"20:35:00": {
"rt": {
"middleValue": 0,
"count": 0,
"highestValue": 0,
"lowestValue": 0,
"timestamp": 1623587700737
}
},
"20:36:00": {
"rt": {
"middleValue": 0,
"count": 0,
"highestValue": 0,
"lowestValue": 0,
"timestamp": 1623587760737
}
},
"20:37:00": {
"rt": {
"middleValue": 0,
"count": 0,
"highestValue": 0,
"lowestValue": 0,
"timestamp": 1623587820737
}
},
"20:38:00": {
"rt": {
"middleValue": 0,
"count": 0,
"highestValue": 0,
"lowestValue": 0,
"timestamp": 1623587880737
}
},
"20:39:00": {
"rt": {
"middleValue": 0,
"count": 0,
"highestValue": 0,
"lowestValue": 0,
"timestamp": 1623587940737
}
},
"20:40:00": {
"rt": {
"middleValue": 0,
"count": 0,
"highestValue": 0,
"lowestValue": 0,
"timestamp": 1623588000737
}
},
"20:41:00": {
"rt": {
"middleValue": 0,
"count": 0,
"highestValue": 0,
"lowestValue": 0,
"timestamp": 1623588060737
}
},
"20:42:00": {
"rt": {
"middleValue": 0,
"count": 0,
"highestValue": 0,
"lowestValue": 0,
"timestamp": 1623588120737
}
},
"20:43:00": {
"rt": {
"middleValue": 0,
"count": 0,
"highestValue": 0,
"lowestValue": 0,
"timestamp": 1623588180737
}
},
"20:44:00": {
"rt": {
"middleValue": 0,
"count": 0,
"highestValue": 0,
"lowestValue": 0,
"timestamp": 1623588240737
}
},
"20:45:00": {
"rt": {
"middleValue": 0,
"count": 0,
"highestValue": 0,
"lowestValue": 0,
"timestamp": 1623588300737
}
},
"20:46:00": {
"rt": {
"middleValue": 0,
"count": 0,
"highestValue": 0,
"lowestValue": 0,
"timestamp": 1623588360737
}
},
"20:47:00": {
"rt": {
"middleValue": 0,
"count": 0,
"highestValue": 0,
"lowestValue": 0,
"timestamp": 1623588420737
}
},
"20:48:00": {
"rt": {
"middleValue": 0,
"count": 0,
"highestValue": 0,
"lowestValue": 0,
"timestamp": 1623588480737
}
},
"20:49:00": {
"rt": {
"middleValue": 0,
"count": 0,
"highestValue": 0,
"lowestValue": 0,
"timestamp": 1623588540737
}
},
"20:50:00": {
"rt": {
"middleValue": 0,
"count": 0,
"highestValue": 0,
"lowestValue": 0,
"timestamp": 1623588600737
}
},
"20:51:00": {
"rt": {
"middleValue": 0,
"count": 0,
"highestValue": 0,
"lowestValue": 0,
"timestamp": 1623588660737
}
},
"20:52:00": {
"rt": {
"middleValue": 2158,
"count": 68,
"highestValue": 4941,
"lowestValue": 1,
"timestamp": 1623588778333
}
},
"20:53:00": {
"rt": {
"middleValue": 2252,
"count": 1815,
"highestValue": 4996,
"lowestValue": 0,
"timestamp": 1623588839757
}
},
"20:54:00": {
"rt": {
"middleValue": 2233,
"count": 2680,
"highestValue": 5000,
"lowestValue": 0,
"timestamp": 1623588899641
}
},
"20:55:00": {
"rt": {
"middleValue": 2306,
"count": 2605,
"highestValue": 4994,
"lowestValue": 0,
"timestamp": 1623588959700
}
},
"20:56:00": {
"rt": {
"middleValue": 2224,
"count": 2669,
"highestValue": 5422,
"lowestValue": 0,
"timestamp": 1623589019949
}
},
"20:57:00": {
"rt": {
"middleValue": 2239,
"count": 2678,
"highestValue": 4997,
"lowestValue": 0,
"timestamp": 1623589079640
}
},
"20:58:00": {
"rt": {
"middleValue": 2233,
"count": 2678,
"highestValue": 4998,
"lowestValue": 0,
"timestamp": 1623589139980
}
},
"20:59:00": {
"rt": {
"middleValue": 2305,
"count": 2601,
"highestValue": 4998,
"lowestValue": 0,
"timestamp": 1623589199745
}
},
"21:00:00": {
"rt": {
"middleValue": 2227,
"count": 2678,
"highestValue": 5000,
"lowestValue": 0,
"timestamp": 1623589259579
}
},
"21:01:00": {
"rt": {
"middleValue": 2243,
"count": 2677,
"highestValue": 4998,
"lowestValue": 0,
"timestamp": 1623589319569
}
},
"21:02:00": {
"rt": {
"middleValue": 2255,
"count": 2656,
"highestValue": 5000,
"lowestValue": 0,
"timestamp": 1623589378556
}
},
"21:03:00": {
"rt": {
"middleValue": 2288,
"count": 2616,
"highestValue": 5000,
"lowestValue": 0,
"timestamp": 1623589439666
}
},
"21:04:00": {
"rt": {
"middleValue": 1272,
"count": 152,
"highestValue": 4271,
"lowestValue": 0,
"timestamp": 1623589441456
}
}
},
"success": true,
"statusCode": 200
}
The statistics part of the Jellyfish interface calls the sdk of the metric module of vortex, so it is based on time series. The default statistical time window is 1 minute, and the first 60 pieces of data are rolled and saved. The historical data does not fall by default, but it can be implemented by implementing the MetricEvictionHandler and MetricSequencerFactory interfaces. To expand, refer to vortex metrics
Finally, the reference configuration of the Jellyfish Server:
spring.application.name=jellyfish-console
spring.application.cluster.name=jellyfish-console-cluster

#management.endpoints.web.exposure.include=*
#management.endpoint.health.show-details=always
#management.security.enabled=false
#spring.boot.admin.client.url=http://localhost:10081

atlantis.framework.vortex.bufferzone.collectionName=jellyfish
atlantis.framework.vortex.bufferzone.pullSize=100

#Elasticsearch Configuration
spring.data.elasticsearch.cluster-name=es
spring.data.elasticsearch.cluster-nodes=localhost:9300
spring.data.elasticsearch.repositories.enabled=true
spring.data.elasticsearch.properties.transport.tcp.connect_timeout=60s

#Redis Configuration
atlantis.framework.redis.host=localhost
atlantis.framework.redis.port=6379
atlantis.framework.redis.password=123456
atlantis.framework.redis.database=0

#Freemarker Configuration
spring.freemarker.enabled=true
spring.freemarker.suffix=.ftl
spring.freemarker.cache=false
spring.freemarker.charset=UTF-8
spring.freemarker.template-loader-path=classpath:/META-INF/templates/
spring.freemarker.expose-request-attributes=true
spring.freemarker.expose-session-attributes=true
spring.freemarker.setting.number_format=#
spring.freemarker.setting.url_escaping_charset=UTF-8
For specific and more detailed parameter settings, please refer to:https://github.com/paganini2008/jellyfish